
- Home
- What Is a Marketing Funnel? (And Where Yours Leaks)
What Is a Marketing Funnel? (And Where Yours Leaks)
A marketing funnel is the path a stranger takes from first hearing about your business to becoming a paying customer. It’s usually mapped across three stages: awareness, consideration, and decision. A leak is when qualified people fall out of that path at a stage they should have kept moving through. Most businesses are losing money there without realizing it.
What Is a Marketing Funnel?
Picture a funnel shape. Wide at the top, narrow at the bottom.
The wide top holds every stranger who could plausibly become a customer. The narrow bottom holds the small number who actually do. Everything in between is the funnel doing its job: sorting a large crowd down into a small, paying one.
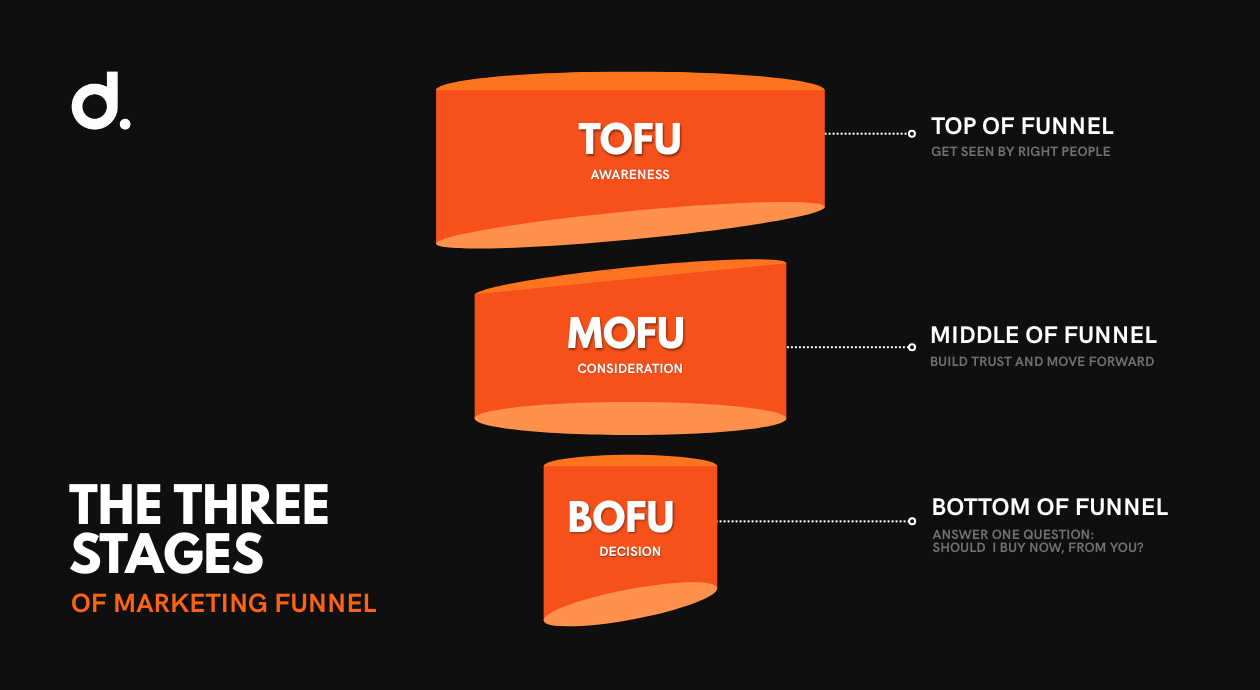
Most businesses describe that shape using three stages.
- Top of funnel (awareness): where a stranger first learns you exist
- Middle of funnel (consideration): where they compare you against alternatives and start to trust you
- Bottom of funnel (decision): where they choose to buy, from you or someone else
The exact words change by company. Some teams say “pipeline.” Others say “customer journey.” The underlying shape stays the same everywhere: a wide crowd narrowing down to a small set of buyers.
If the term “funnel” has ever felt confusing, that’s common. It’s confusing enough that people actively debate what it means online.
The Three Stages Everyone Refers To (TOFU, MOFU, BOFU)
- Top of funnel (TOFU): awareness. A blog post, a social ad, a friend’s recommendation. The job here is simply to get seen by the right people.
- Middle of funnel (MOFU): consideration. An email nurture sequence, a webinar, a comparison guide. The job here is building enough trust to move someone forward.
- Bottom of funnel (BOFU): decision. A product demo, a pricing page, a consultation call. The job here is answering one question: should I buy this, now, from you.
Marketing Funnel vs. Sales Funnel: Are They the Same Thing?
Not quite. Same underlying shape, different span.
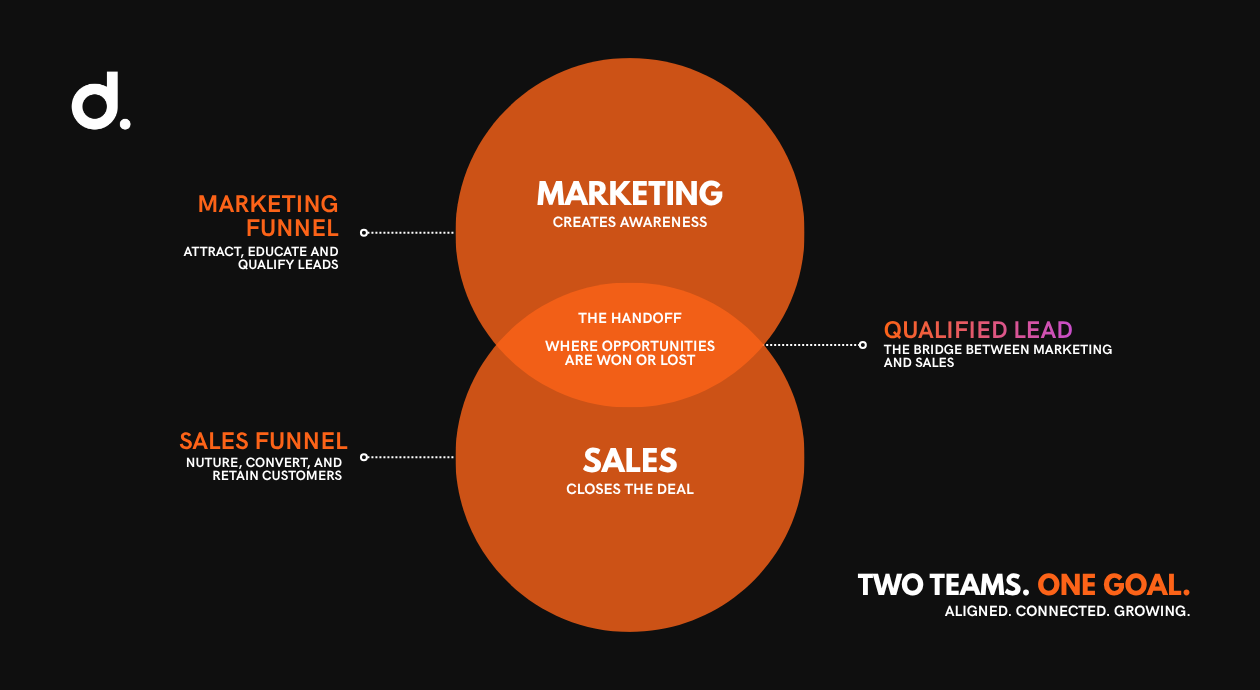
- A marketing funnel typically ends when a stranger becomes a qualified lead.
- A sales funnel picks up from that same lead and tracks them through to a closed deal.
Marketing owns the first half. Sales owns the second half. The handoff between them, where one ends and the other begins, is exactly where a surprising amount of revenue quietly disappears.
What Does It Mean When a Funnel Is Leaking?
Every funnel narrows. On its own, that’s not a problem. Most people who see an ad were never going to buy. Losing them at the top is qualification working as intended.
Leakage is something else. It’s when a good-fit lead drops out because of a fixable, internal problem, not a legitimate no.
- A bug on the checkout page
- A follow-up email that never went out
- A pricing page that confuses more than it clarifies
A stranger who was never going to buy isn’t a leak. A ready buyer who quietly disappears is. The question worth asking at every stage isn’t “why did the numbers get smaller.” It’s “did the right people fall out here, or the wrong ones.”
The Invisible Leak: Why a Full-Looking Funnel Can Still Be Losing Money
A funnel can look healthy and still be losing serious money. Strong traffic. Plenty of interest. But if nobody’s watching the handoffs between stages, revenue disappears before a lead ever reaches a human.
Fractional revenue consultant Dhaval Shah, writing for PMGuru, tracked this across more than 15 consulting engagements. His finding: businesses lose an average of about 40 percent of their addressable demand, in a range of 30 to 50 percent, before it ever reaches active sales engagement. Three leak points account for most of it.
- Marketing-to-sales handoff: 15 to 20 percent of the loss
- Pricing misalignment: 10 to 15 percent
- Attribution blindness: 5 to 10 percent
This is one practitioner’s reported consulting data, not an independent academic study. But the pattern it describes, revenue disappearing between departments rather than at the top of the funnel, matches what shows up across the diagnostic process below. It also carries a quiet second cost: every lead lost to a preventable leak still cost you the ad spend, content hours, and sales time it took to generate. That pushes your real customer acquisition cost higher, even though it never shows up as a line item labeled “leak.”
The Warning Signs Your Funnel Is Leaking Money
Top-of-Funnel Signs
- Traffic is healthy, but almost nothing converts into a lead
- Often a technical issue: a cross-browser bug, a slow-loading page
- Sometimes a mismatch between what the ad promises and what the landing page delivers
- A high bounce rate specifically on the pages meant to capture interest
Middle-of-Funnel Signs
- Leads come in, then just go cold, usually a nurturing or lead-scoring gap
- Marketing calls a lead “qualified.” Sales disagrees.
- That handoff-definition gap is the single most common leak point in the Invisible 40 percent data above
Bottom-of-Funnel Signs
- High drop-off at checkout, at the proposal stage, or right after a demo
- Usually a trust, pricing-clarity, or friction problem at the moment someone was about to commit
- Slow follow-up after a high-intent action: a demo request, a pricing page visit, an item added to cart
Response speed matters more than most teams realize. MIT’s original Lead Response Management study, led by Dr. James Oldroyd and later confirmed in a 2011 Harvard Business Review analysis of 2,241 companies, found that contacting a web-generated lead within five minutes rather than thirty makes a business roughly 100 times more likely to make contact, and 21 times more likely to qualify that lead. That’s the size of the gap a slow response quietly creates.
How to Actually Find Where You're Losing Money
Step One: Map Every Stage Before You Touch Anything
Write out every real step a person takes between being a stranger and becoming a customer: traffic source, landing page, form, follow-up, proposal or checkout, close.
This simple funnel visualization, even sketched on a whiteboard, is worth building first. A sales funnel template can speed this up if you’d rather start from a structure than a blank page.
Skipping this step is the most common mistake in funnel diagnosis. Jumping straight to fixes before mapping the path usually means fixing the wrong thing.
Step Two: Pull Your Stage-by-Stage Conversion Numbers
Once every stage is mapped, pull the real conversion rate between each one. Here’s a simplified, illustrative example.
| Funnel Stage | People at This Stage | Conversion to Next Stage |
|---|---|---|
| Website visitors | 8,000 | 18% to lead form |
| Leads captured | 1,440 | 62% to first response |
| Contacted / nurtured | 893 | 9% to proposal or demo |
| Proposal / demo | 80 | 35% to closed-won |
| Customers | 28 | final stage |
The top line looks healthy on its own: 8,000 visitors is a solid number. Look closer, though. Only 9 percent of contacted leads make it to a proposal or demo. That single mid-funnel stage is where most of this business’s revenue is quietly disappearing, and no top-of-funnel number would ever reveal that by itself.
Step Three: Ask Why, Beyond the Dashboard
Numbers show where the leak is. They don’t explain why.
- Session recordings and heatmaps are a reasonable next step
- The most underused method: call 8 to 10 people who recently dropped out of your funnel and ask what made them stop
This works with any analytics setup. The value is in the questions you ask, not the tool you use to ask them.
What a Healthy Funnel Conversion Rate Actually Looks Like
There’s no single honest number here. A blended average across every industry hides more than it reveals.
B2B Benchmarks
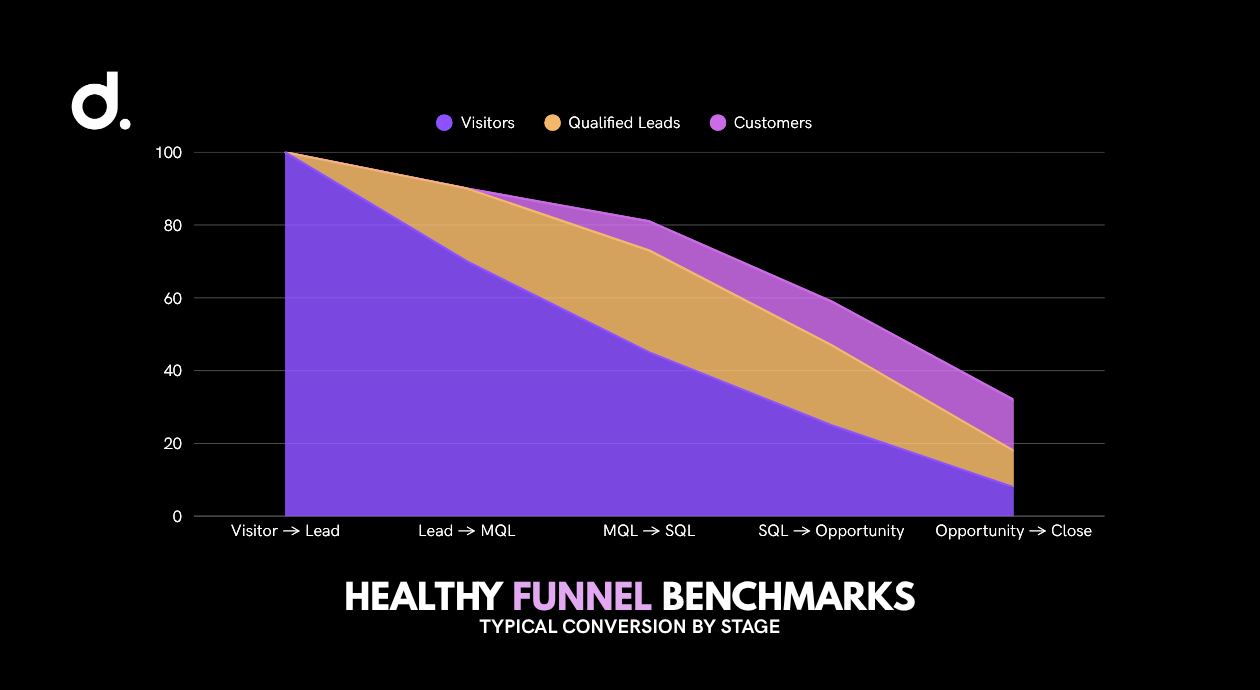
First Page Sage’s 2026 research across 24 B2B industries puts the median visitor-to-lead conversion rate at roughly 1.9 percent, with real spread underneath that median. Further down the funnel, aggregated 2026 data from First Page Sage and Ruler Analytics shows:
- Lead to marketing qualified lead (MQL): 25 to 35 percent
- MQL to sales qualified lead (SQL): 13 to 26 percent
- SQL to opportunity: 50 to 62 percent
- Opportunity to close: 15 to 30 percent
Ecommerce Benchmarks
Multiple 2026 industry benchmark reports converge on similar figures.
- Average visitor-to-purchase rate: roughly 2.5 to 3 percent globally
- Top-performing stores: 5 percent or higher
The useful move isn’t memorizing any of these numbers. It’s comparing your own stage-by-stage rates against a benchmark specific to your industry and channel, then fixing whichever stage falls furthest below it.
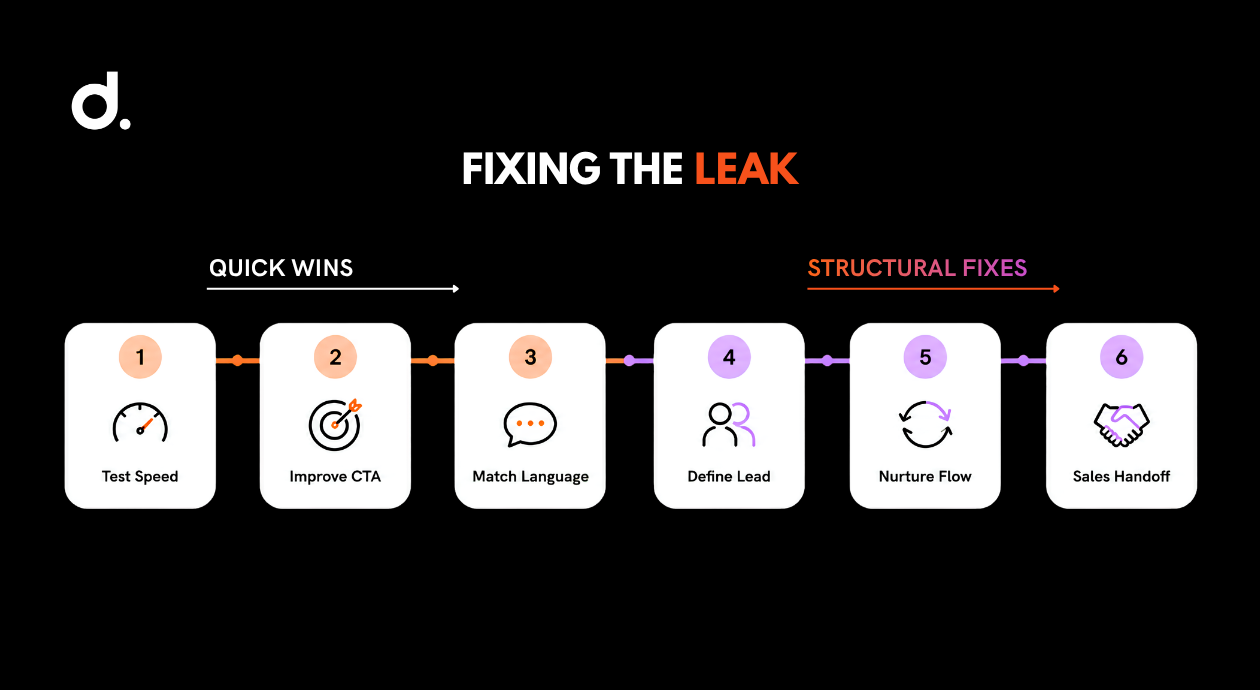
Fixing the Leak: Quick Wins vs. Structural Fixes
Not every fix deserves the same timeline. Some are worth testing this week. Others are worth building properly over the next quarter.
Quick Wins You Can Test This Week
- Run a cross-browser and page-speed check, but only on the pages inside your funnel
- Rewrite one weak call to action and test it before touching anything else
- Match your page language to the words customers actually use to describe their problem
Structural Fixes Worth the Longer Timeline
- A shared, written definition of “qualified lead,” agreed on by marketing and sales. This is the single highest-leverage fix in the Invisible 40 percent data.
- A real lead-nurturing cadence, replacing a one-off follow-up email
- A formal response-time commitment between marketing and sales
Real Funnel Leaks That Got Fixed
The clearest, most independently corroborated funnel-leak case study in conversion research doesn’t come from a funnel guide. It comes from UX research, and it’s worth knowing by name.
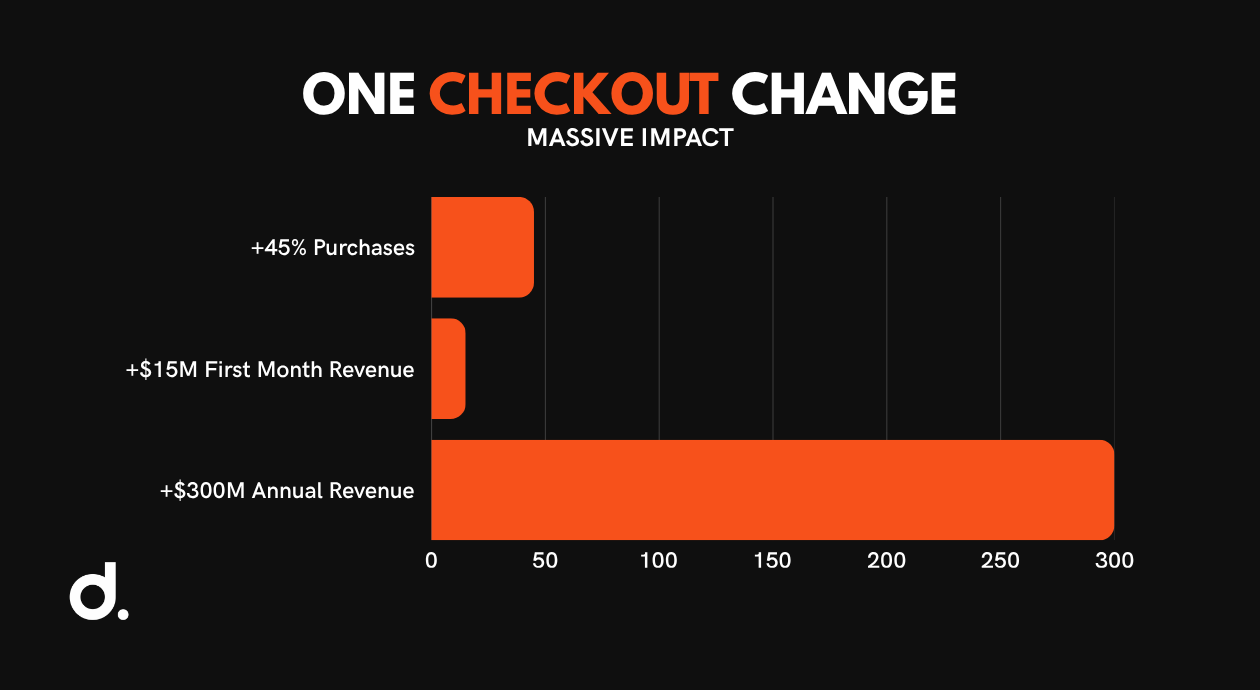
A major e-commerce retailer forced every first-time shopper to register an account before checkout. Usability researcher Jared Spool and his team at User Interface Engineering found this single requirement was where a large share of otherwise-ready buyers gave up.
The fix: replace the “Register” button with a “Continue” option. The result:
- Purchases up 45 percent, almost immediately
- An extra 15 million dollars in the first month
- Roughly 300 million dollars in additional revenue over the following year
Originally documented by Spool in 2009, it remains one of the most widely corroborated case studies in the field. The leak was never a demand problem. Interest was already there. One unnecessary step stood between a ready buyer and a completed sale.
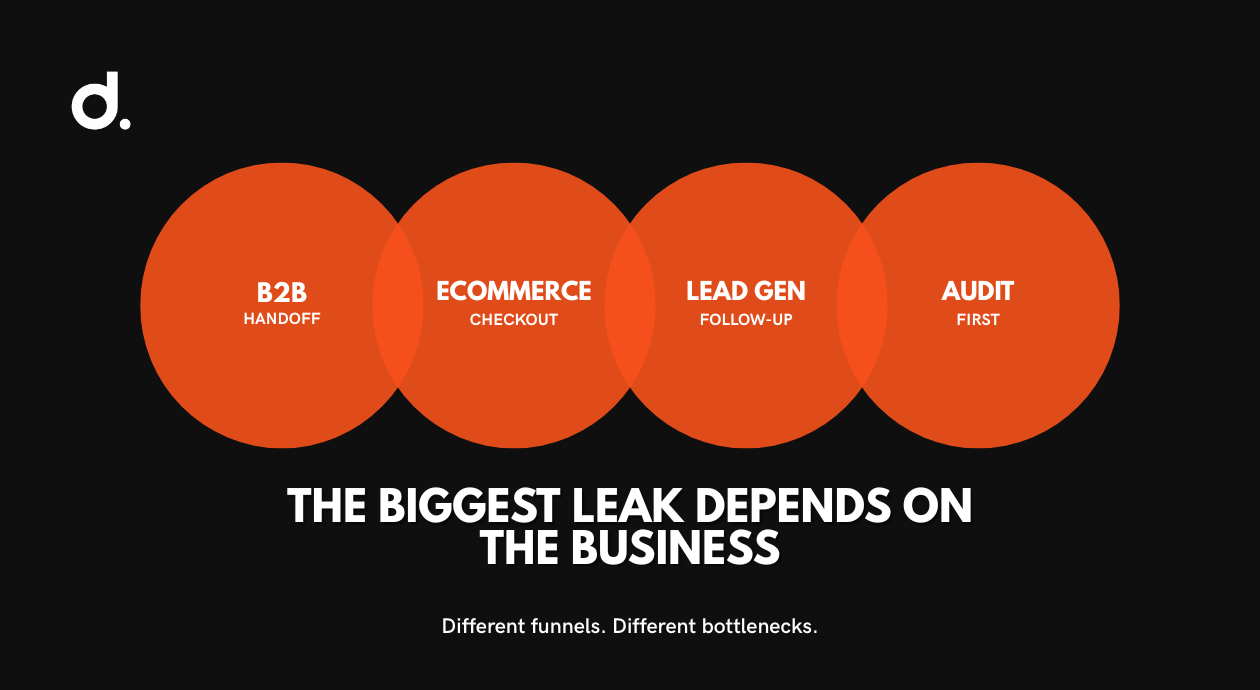
Does This Look Different for B2B, Ecommerce, and Lead-Gen Funnels?
The warning-sign categories above apply everywhere. Where the biggest leak actually sits shifts by business type.
- B2B, longer sales cycle: almost always the marketing-to-sales handoff and attribution
- Ecommerce: typically cart and checkout abandonment, often worsened by mobile page speed
- Local service and lead-gen: usually response time, the gap between a form submission and an actual human follow-up
Frequently Asked Questions
What is sales funnel in marketing?
A sales funnel is the step-by-step path a prospect follows from first learning about a product to buying it. It narrows at each stage: many people see an ad, fewer request information, fewer still buy. That’s why it’s visualized as a funnel.
What is a marketing funnel vs. a sales funnel?
Same underlying shape, different ownership. A marketing funnel typically ends when a stranger becomes a qualified lead. A sales funnel picks up from there and tracks them through to a closed deal, usually owned by sales.
What is a good funnel conversion rate?
It depends on industry, channel, and funnel stage, so a blended average is misleading. Compare your own stage-by-stage rates against a benchmark specific to your industry, not a generic overall number.
How do I find where my funnel is leaking?
Map every real step between a stranger and a customer, then pull the conversion rate between each step. The stage with the steepest, most abnormal drop-off is your biggest leak. Confirm the cause with heatmaps, recordings, or direct interviews with recently lost leads.
Is a leaking funnel always a bad thing?
No. Some drop-off is normal qualification, not leakage. A true leak is when a good-fit prospect drops out because of something fixable, like a slow follow-up or a confusing page, rather than a legitimate mismatch with your product.
The Bottom Line
A leaking funnel is rarely a traffic problem. It’s a visibility problem. Most businesses already generate enough interest to hit their numbers. They just can’t see where that interest disappears before it turns into revenue.
Try this, this week.
- Pull your last 90 days of lost leads
- Walk each one back through the stages above
- Note exactly where it stopped moving
That single exercise will tell you more about your real leak point than another month of watching the same top-line traffic number.