- Home
- Seven of Ten Carts Get Abandoned, and Most Fixes Miss
Seven of Ten Carts Get Abandoned, and Most Fixes Miss
Cart abandonment sits at roughly 70% globally and has not moved in a decade, which means the number itself is not the problem. The problem is that most brands answer a 70% abandonment rate with one fix, usually a checkout tweak or a discount email, when the actual leak could be in any of four places that fix never touches.
THE SHORT ANSWER
Cart abandonment happens when a shopper adds a product to their cart but leaves before completing checkout. The global rate has held near 70% for over a decade. The real diagnostic question is not the number. It is which of four leaks, pre-cart, checkout UX, payment stack, or attribution, is actually driving it.
What "70%" Actually Means
The number has not moved in a decade, and that is the real signal
The 70% figure everyone quotes comes from the Baymard Institute, which averages 50 separate cart abandonment studies to arrive at 70.22% (Baymard Institute, last updated September 2025). It is the most cited number in ecommerce for a reason: it is a meta analysis, not a single vendor survey.
What matters more than the number is how stubborn it is:
- Baymard’s running average has sat in the high 60s to low 70s for well over a decade
- That decade covered one click checkout, digital wallets, autofill, and an entire industry built around checkout optimisation
- The rate absorbed all of it and stayed where it was
A number that refuses to move despite that much industry wide investment is telling you something. If checkout design were the whole story, a decade of checkout design improvement would have shifted it. It did not.
How much of that 70% is even recoverable?
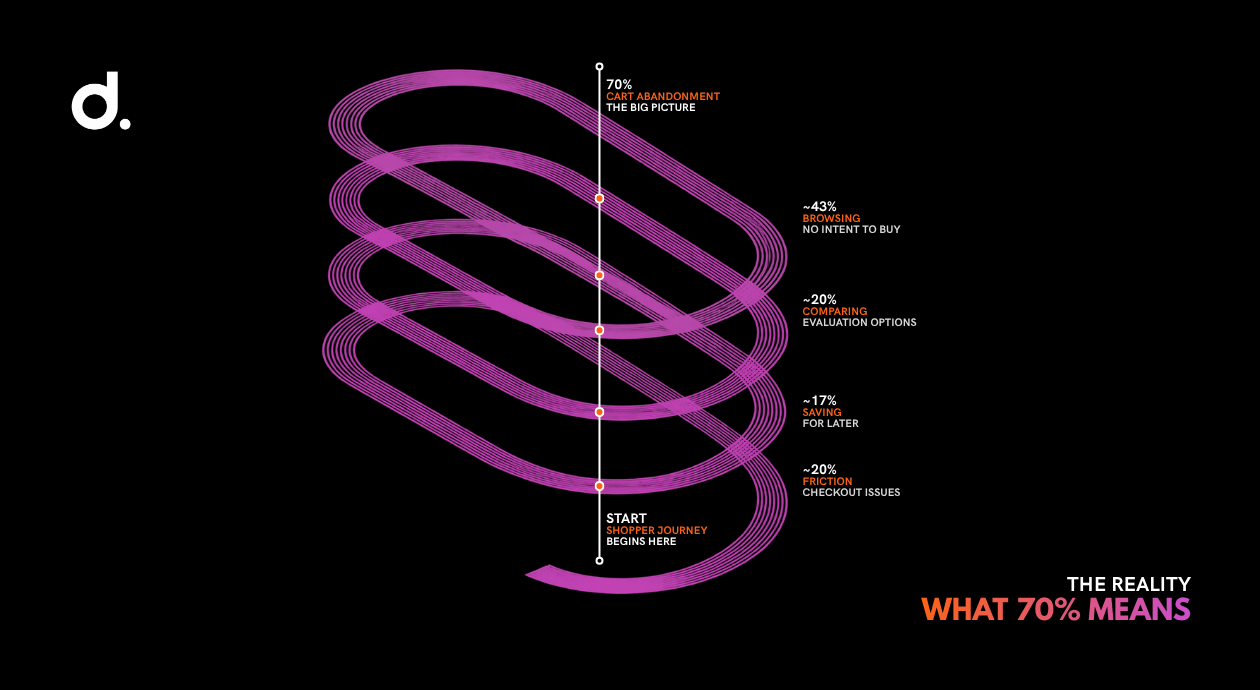
Baymard’s survey work also found that a large share of abandonment is not a problem at all. It is people browsing, comparing, saving something for later, or window shopping with no intention of buying today.
VERIFY THIS FIGURE BEFORE YOU PUBLISH IT
The browsing share is cited as 42% in some write ups and 43% in others, both attributed to the same underlying Baymard research. Check the current figure on Baymard’s own page rather than repeating a competitor’s rounding. The discrepancy is small, but the habit is the point.
The practical consequence is significant. Your realistic target was never zero, and it was never even the full 70%. It is the fixable share underneath it. Treating the entire 70% as recoverable is itself one reason brands misdiagnose the problem: they go looking for a single large failure when what they have is a mix of normal browsing behaviour and several smaller, separate leaks.
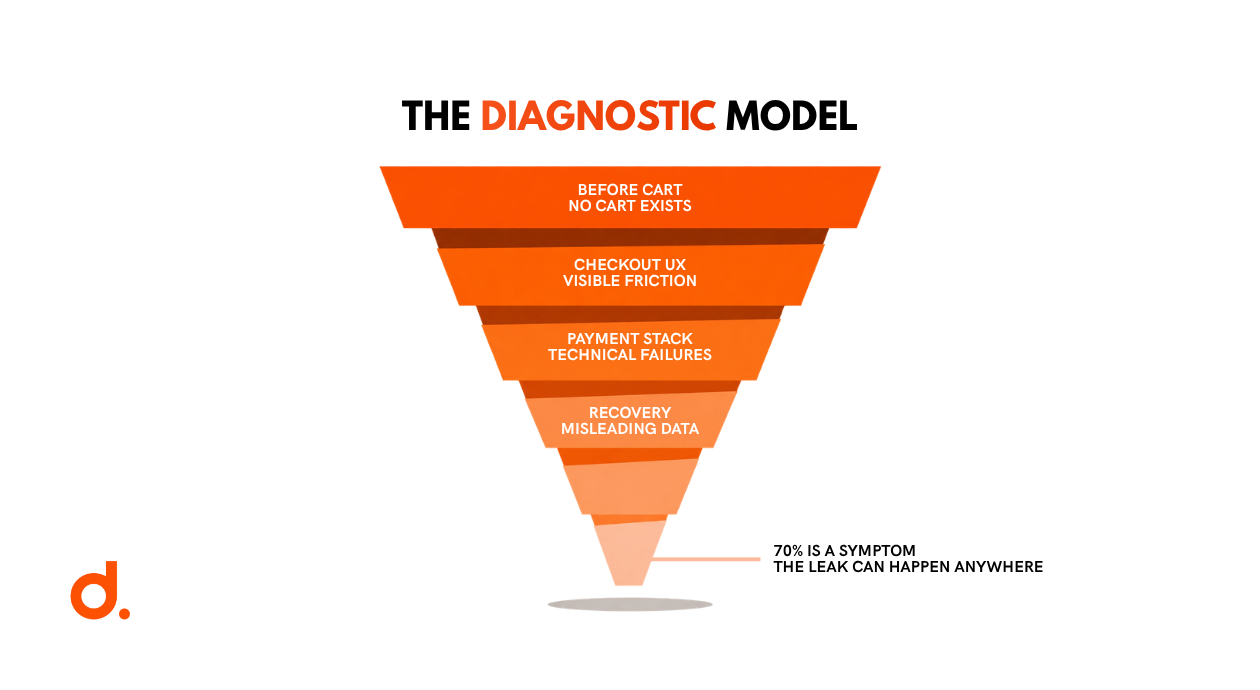
70% is not a diagnosis. It is a symptom with at least four possible causes.
The Diagnostic Model: Four Places a Cart Actually Leaks
Most cart abandonment advice treats the checkout page as the whole funnel. It is not. A shopper can be lost at four distinct points, and each one fails in a way the others cannot detect.
| Leak | What it looks like | Why it gets missed |
|---|---|---|
| 1. Before the cart | The shopper never adds to cart at all, or views the same product repeatedly without adding | No cart exists, so no cart recovery tool can see it |
| 2. Checkout UX | Cost surprises, forced account creation, long forms, unclear totals | It does not get missed. This is the leak everyone already works on |
| 3. The payment stack | Soft declines, false declines, missing local payment methods, failed renewals | The data sits with the payment processor, not the marketing or CRO team |
| 4. Recovery attribution | Sales counted as "recovered" that would have happened anyway, or real recovery missed because flows overlap | Fixing it makes your reported numbers look worse, so nobody volunteers |
Leak 1: Before the cart
Browse abandonment and repeated product views with no add to cart action are invisible to every cart recovery tool you own, because the shopper never created a cart to recover. This is a quieter and usually larger pool of interested people than the cart abandoners you are already emailing.
Browse, back in stock, and price drop flows running together often out earn the cart email on its own, simply because they catch shoppers earlier and in greater numbers.
Leak 2: Checkout UX
This is the familiar list, and it is familiar for a good reason:
- Extra costs appearing at the final step
- Forced account creation before purchase
- Long or repetitive form fields
- Totals that stay unclear until the last screen
These are real causes and worth fixing. The point is that this is the leak almost every team already optimises for, because it is the one page they can see, test, and screenshot. Being the most visible leak is not the same as being the biggest one.
Leak 3: The payment stack
This is the leak most guides skip entirely, and it is often the one costing real money:
- Soft declines. Temporary failures, such as a bank flagging an unusual transaction, that look identical to a permanent decline from the shopper’s side.
- False declines. Fraud rules calibrated too tightly, blocking legitimate customers who then assume your site is broken.
- Missing local payment methods. A shopper who does not see the method they use in their market rarely complains. They just leave.
Note on sourcing: specific soft decline percentages circulating in this space are usually vendor reported figures from payment platforms. Attribute them to the vendor by name rather than presenting them as independently verified industry data.
Leak 4: Recovery attribution
The uncomfortable one. A sale attributed to a recovery email the customer never opened flatters every dashboard except the real number. When measurement is generous, two things happen at once:
- You overstate how much revenue your recovery flows are actually producing
- You understate where you are still leaking, because the credit has already been assigned elsewhere
Both errors point you toward doing more of what you are already doing, which is exactly how a brand spends two years optimising the wrong leak.
Why Most Brands Fix the Wrong One
This is not incompetence. It is a predictable ranking problem. Teams fix the leak they can see, in the order they can see it:
- Leak 2 wins by default. The checkout page is the page every team already looks at, and every CRO tool on the market is built to test it.
- Leak 3 is invisible without processor data. Soft and hard decline splits sit with the payment provider, and most marketing and CRO teams never see that report. A leak you cannot measure cannot be prioritised.
- Leak 1 has no cart to track. Browse abandonment does not appear in cart recovery reporting by definition, so it is absent from the numbers the team reviews each week.
- Leak 4 is unpopular. Tightening attribution makes recovery revenue look smaller, not bigger. Nobody is rewarded for that in a quarterly review.
Put plainly, in the words of most operators: we keep testing the checkout page because that is the page we can see.
How to Actually Diagnose Which Leak You Have
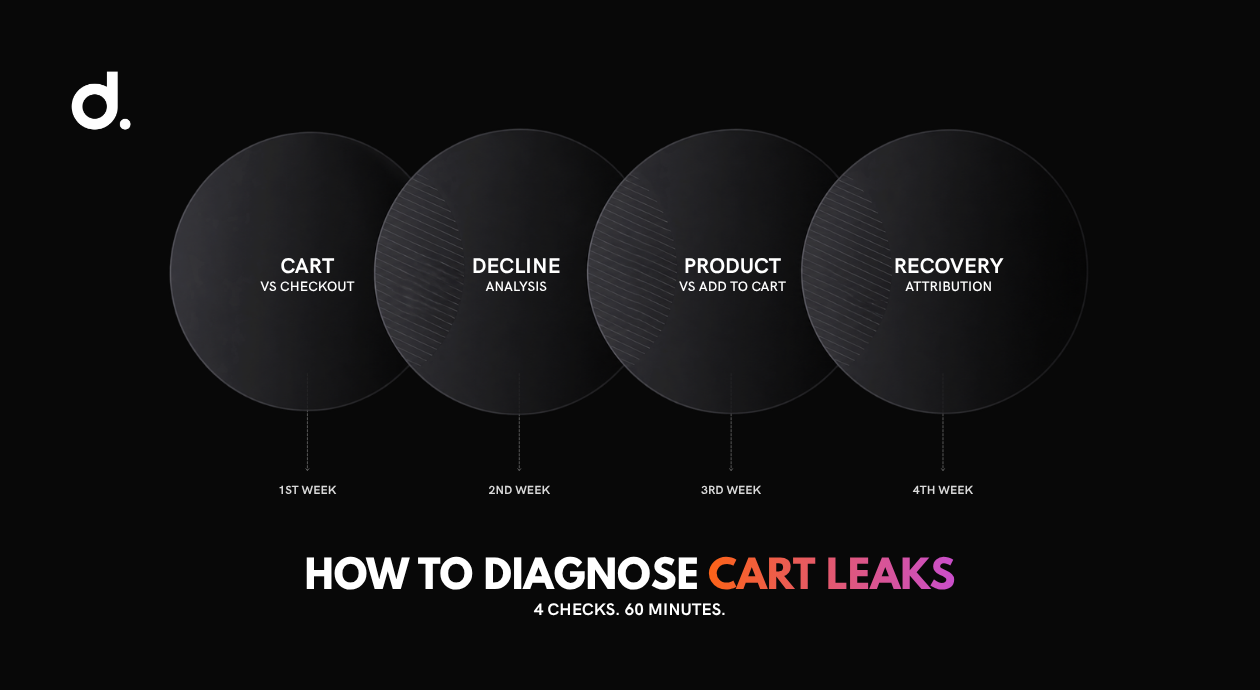
Four checks. You can run all of them against data you already have, usually inside an hour.
- Compare cart abandonment to checkout abandonment. Cart abandonment measures from add to cart onward. Checkout abandonment only measures drop off after a shopper begins entering details. A wide gap between the two tells you the loss is upstream. A narrow gap with a high checkout rate points downstream, at payment.
- Pull your card decline rate and split it. Ask your payment processor for soft versus hard declines. If soft declines are a meaningful share of failed payments, Leak 3 is live and no amount of checkout copy will touch it.
- Compare product page views to add to cart rate. A healthy add to cart rate paired with a weak checkout completion rate points at Leak 2. A weak add to cart rate points upstream at Leak 1, before the cart ever existed.
- Audit your recovery attribution model directly. Ask one question: is recovered revenue tracked at the order level against a specific send, or just correlated in time? If it is correlated, your recovery numbers are a guess wearing a suit.
DO THIS FIRST
Pull last month’s cart abandonment and checkout abandonment rates side by side before you read another “fix your checkout” article. That single comparison tells you whether you are looking upstream or downstream.
Fixing Each Leak
Once you know which leak you have, the fixes are specific. Match the fix to the diagnosis, not to whatever tactic is circulating this month.
Leak 1 fixes: before the cart
- Run browse abandonment, back in stock, and price drop flows alongside your cart sequence, not instead of it
- Segment repeat product viewers who never added to cart and treat them as their own audience
Leak 2 fixes: checkout UX
- Show shipping, tax, and fees before the final step
- Allow guest checkout and make it the default path
- Cut form fields to the ones you genuinely need to fulfil the order
- Add a progress indicator so shoppers know how much is left
Leak 3 fixes: the payment stack
- Add retry logic timed to reissue soft declines that are likely to succeed on a second attempt
- Recalibrate fraud rules against real risk signals rather than blanket thresholds
- Match payment method coverage to every market you actually sell into
Leak 4 fixes: recovery attribution
- Move to order level attribution for every recovery send
- Run a holdout group where your volume allows it, and compare reported recovery against it on a regular schedule
DO THIS NEXT
Pick the single leak your diagnosis pointed at and fix one thing inside it this month. Shipping four fixes across four leaks at once leaves you unable to tell which one worked.
A Word on the Statistics You Will See Everywhere
This topic has a sourcing problem, and it is worth naming because it directly affects the decisions you make with these numbers.
Two patterns show up repeatedly in current cart abandonment content:
- The same figure appears with different values. Mobile abandonment attributed to the same benchmark provider currently circulates as roughly 78%, 80%, and 85% across different 2026 roundups, all citing the same source name.
- Industry breakdowns credit a source that does not publish them freely. Per category abandonment tables are frequently labelled with a primary research institute’s name, when the numbers actually pass through one or more downstream aggregators first.
Neither pattern means the underlying research is bad. It means the number in front of you may have been copied several times before it reached you, and copies drift.
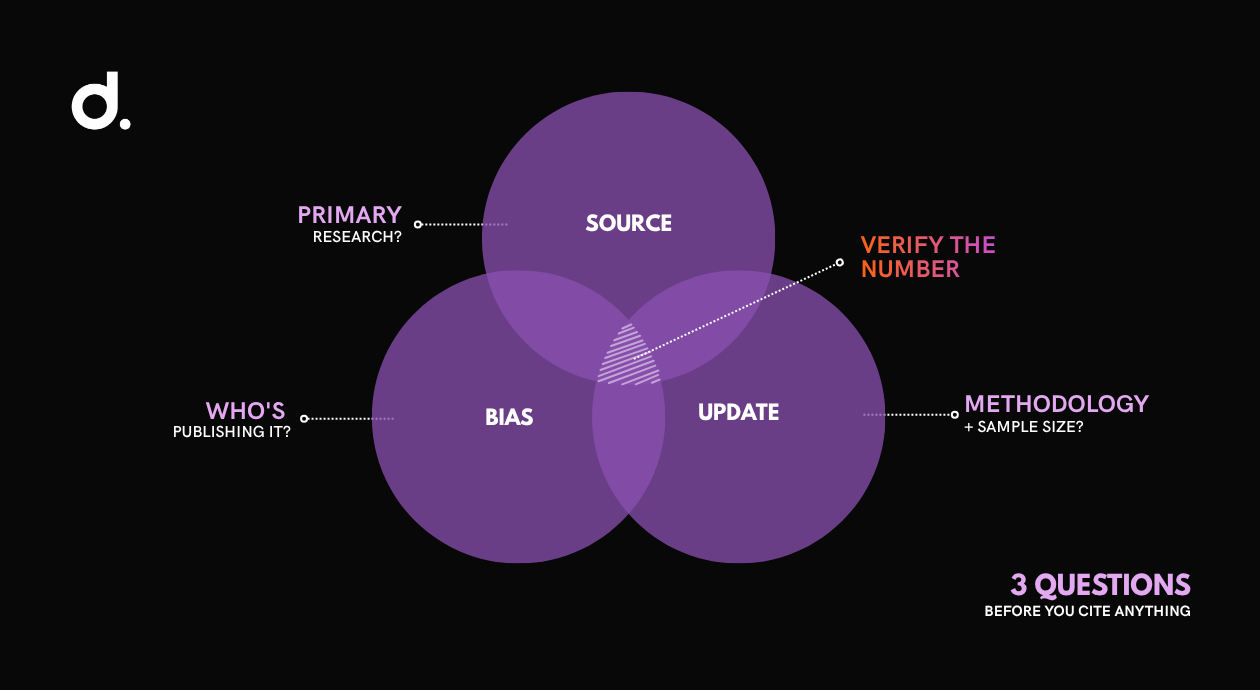
THE THREE QUESTION TEST BEFORE YOU CITE ANYTHING
- Does this figure trace back to a named primary source, or to another blog citing another blog?
- Is the source self interested? A payment platform citing payment related abandonment causes is a legitimate practitioner voice, but it is not a neutral one. Say so when you cite it.
- When was it last updated, and does the source publish its methodology and sample size?
Primary sources worth citing directly in this space include the Baymard Institute, Dynamic Yield, Statista, and Salesforce’s Shopping Index. Go to the source page and read the current number rather than inheriting someone else’s rounding.
What Good Actually Looks Like
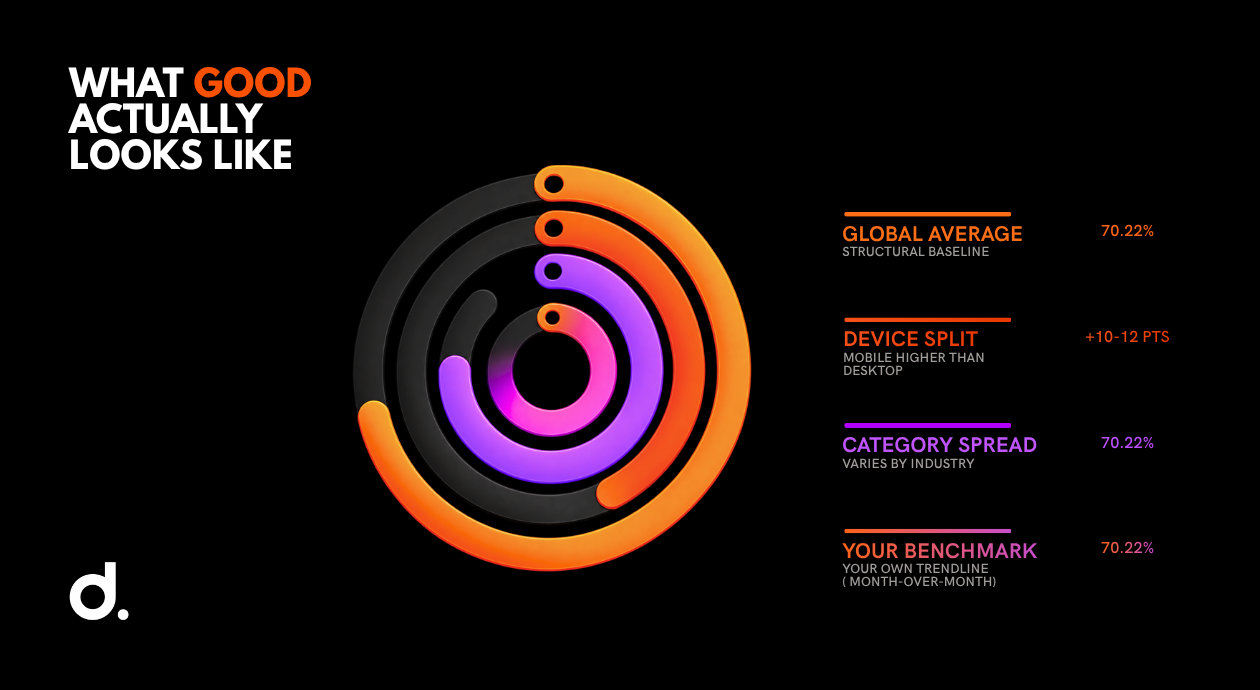
Applying that discipline, here are the benchmarks worth measuring against, with what each one is and is not:
| Benchmark | Figure | What it is, and what it is not |
|---|---|---|
| Global average | 70.22% | Baymard Institute meta analysis of 50 studies, updated September 2025. A structural baseline, not a target |
| Device split | Mobile runs roughly 10 to 12 points above desktop | Dynamic Yield network data. Directional, and the exact figures vary between published versions. Verify at source |
| Category spread | Roughly 50% at the low end to above 80% at the high end | Beauty and luxury sit near the top, pet care and grocery near the bottom. High consideration categories abandon more by nature |
| Your real benchmark | Your own trend line | Your category average, then your own rate month over month. The global figure tells you almost nothing about your store |
A 70% rate in a high consideration category is normal. The same 70% in grocery or pet care means something is broken. Comparing yourself to a global average is how brands either panic or relax for no good reason.
Frequently Asked Questions
What is a good cart abandonment rate?
There is no single good number. It depends on industry, device mix, and price point. The global average sits around 70%, but categories like pet care run closer to 50% while beauty and luxury run near 80%. Compare your rate against your specific category benchmark and your own trend over time, not the global figure.
Why has the cart abandonment rate stayed at 70% for so long?
Baymard Institute data shows the global aggregate has held close to 70% for over a decade, despite continuous checkout UX innovation across the industry. That stability suggests checkout design alone is not the whole story. A meaningful share of abandonment traces to unavoidable browsing behaviour, payment layer failures, and other causes that page level fixes never touch.
What causes most cart abandonment?
Documented reasons include unexpected costs at checkout, forced account creation, long or complicated forms, and unclear total pricing. A real but less visible share also traces to payment failures such as soft declines and missing local payment methods, which shoppers experience as “payment failed” without knowing whether the failure was temporary or permanent.
What is the difference between cart abandonment and checkout abandonment?
Cart abandonment covers the full path from adding a product to cart through final payment. Checkout abandonment is narrower, measuring only drop off after a shopper has started entering payment or shipping details. Comparing the two rates tells you whether your leak sits upstream, before payment, or downstream, at payment.
Do abandoned cart recovery emails actually work?
Yes, generally, when timed well. A short sequence starting within an hour of abandonment tends to recover a meaningful share of carts. But recovery email performance is also one of the easiest metrics to overstate, since a sale can be attributed to an email the customer never opened. Insist on order level attribution before trusting the reported number.
Stop Fixing. Start Diagnosing.
Seven in ten carts get abandoned, and that number is not going to move because you shipped another exit popup. It is a symptom with at least four possible causes, and the brands that actually shift it are the ones who work out which cause they have before they spend a quarter fixing the wrong one.
The order matters. Diagnose, then fix, then measure honestly enough that you can tell whether it worked.
YOUR NEXT STEP
Pull your cart abandonment and checkout abandonment rates side by side this week and see which leak you are actually looking at. If you want a second pair of eyes on the numbers, we will map the full journey with you. One conversation. No pressure.