
How to Actually Measure Marketing ROI (and Defend It to Anyone)

Marketing ROI measures the financial return created by marketing relative to its cost. The difficult part is not the formula. It is deciding which revenue marketing truly influenced, counting the full cost, separating short-term performance from brand effects, and reporting uncertainty clearly enough that finance, sales, and leadership can trust the number.
If someone asks, “What was marketing ROI last quarter?” and your team answers in under ten seconds, I would ask what they left out.
Not because ROI has to be complicated.
Because most marketing systems are.
Paid search closes demand created by other channels. Content influences buyers months before the demo. A podcast mention creates direct traffic nobody can trace. Brand activity raises conversion rates across paid media. Sales closes the deal. Customer success generates the renewal.
Then a dashboard says, “Marketing generated $417,293.62.”
The decimal places are doing a lot of emotional work there.
A defendable ROI number is not the number with the most precision. It is the number whose assumptions are visible.
Why Marketing’s ROI Problem Is Usually a Measurement Problem
Plenty of marketing performs poorly. That is real.
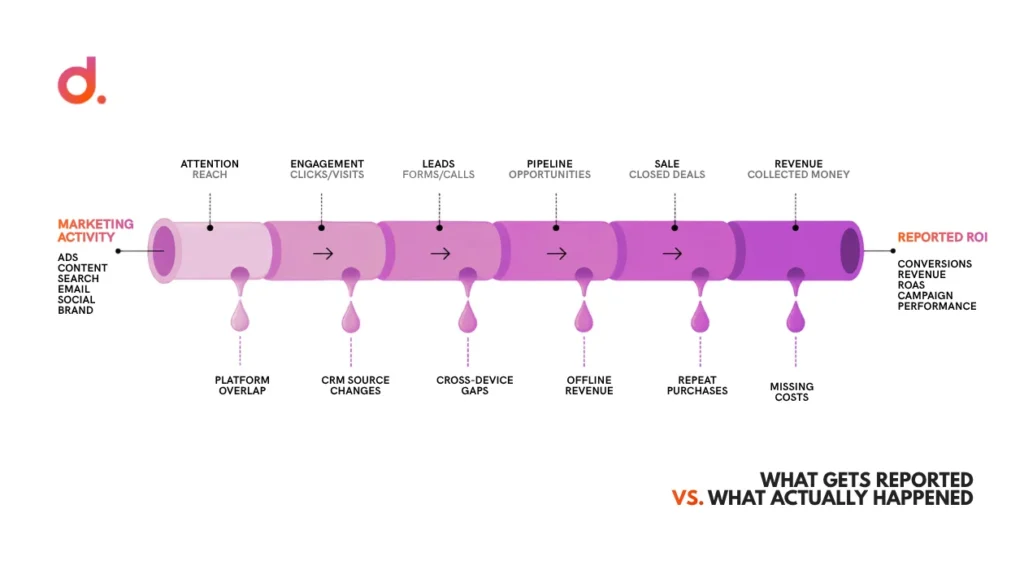
But businesses also misdiagnose good marketing because their measurement system stops before revenue.
Common examples:
- Marketing reports leads, while finance cares about collected revenue.
- Sales changes the source field in the CRM, breaking acquisition history.
- Offline deals never pass back to the marketing platform.
- Branded search receives last-click credit for demand created elsewhere.
- Repeat revenue is credited to “direct” even though email or content influenced retention.
- Platforms each claim the same conversion.
- Brand activity is evaluated inside a 30-day performance window.
- Costs include media but exclude creative, software, people, and agency fees.
A marketing team can improve the campaign and still fail the board meeting if the measurement chain cannot explain how attention became money.
That is why Digital Shaping starts with the system. Our conversion rate optimization work and performance reviews follow the journey through the funnel rather than treating the click as the outcome.
Get the Formula Right First
The basic formula is:
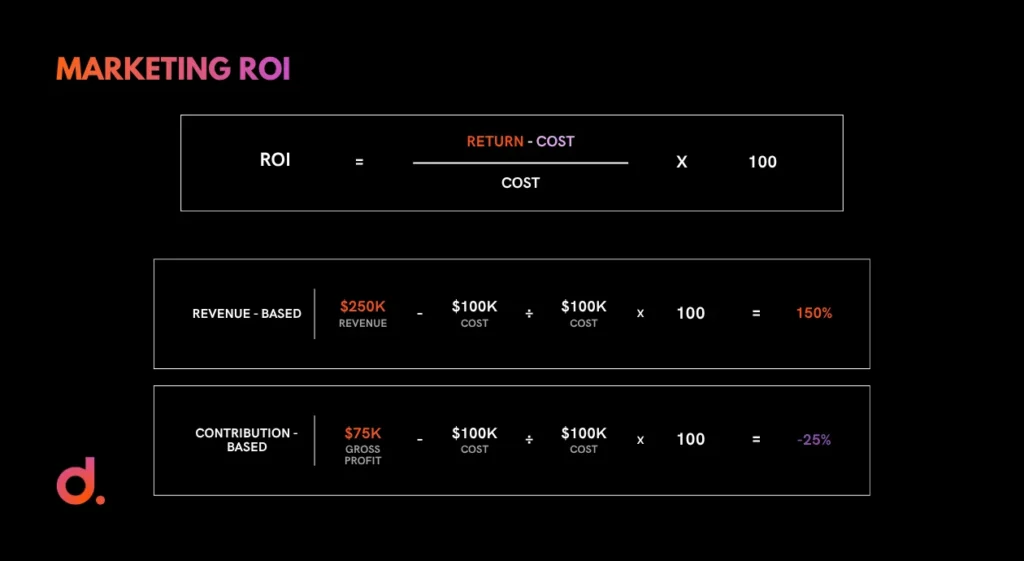
Marketing ROI = ((Marketing return − Marketing cost) ÷ Marketing cost) × 100
The formula is easy.
The argument is inside the words return and cost.
Revenue-Based ROI
Suppose marketing is attributed $250,000 in net revenue and costs $100,000.
ROI = (($250,000 − $100,000) ÷ $100,000) × 100 = 150%
That is mathematically correct if revenue is the chosen return measure.
It may be financially misleading.
If the product has a 30% gross margin, $250,000 of revenue produces only $75,000 of gross profit before other costs. The campaign could look profitable on a revenue-based ROI formula while destroying contribution margin.
Profit- or Contribution-Based ROI
A stricter version uses the profit contribution associated with marketing-generated sales.
If those same sales produce $75,000 in gross profit against $100,000 in marketing cost, the economics are very different.
For ecommerce and other margin-sensitive businesses, contribution-based reporting is often closer to what finance actually needs.
Count the Full Marketing Cost
If you want to defend the number, include the costs required to produce it.
Depending on the question, that can include:
- Media spend.
- Agency fees.
- Creative production.
- Marketing software.
- Freelancers.
- A fair share of salaries.
- Affiliate commissions.
- Influencer fees/product cost.
- Discounts or promotional subsidies where relevant.
- Events and sponsorships.
- Data/measurement tools.
Do not compare a channel’s revenue with media spend only and call the result “company marketing
ROI.”
Call it what it is.
Measure Performance Marketing ROI Channel by Channel
Performance marketing is easier to measure than brand marketing because the intended action is closer to the spend.
Easier does not mean easy.
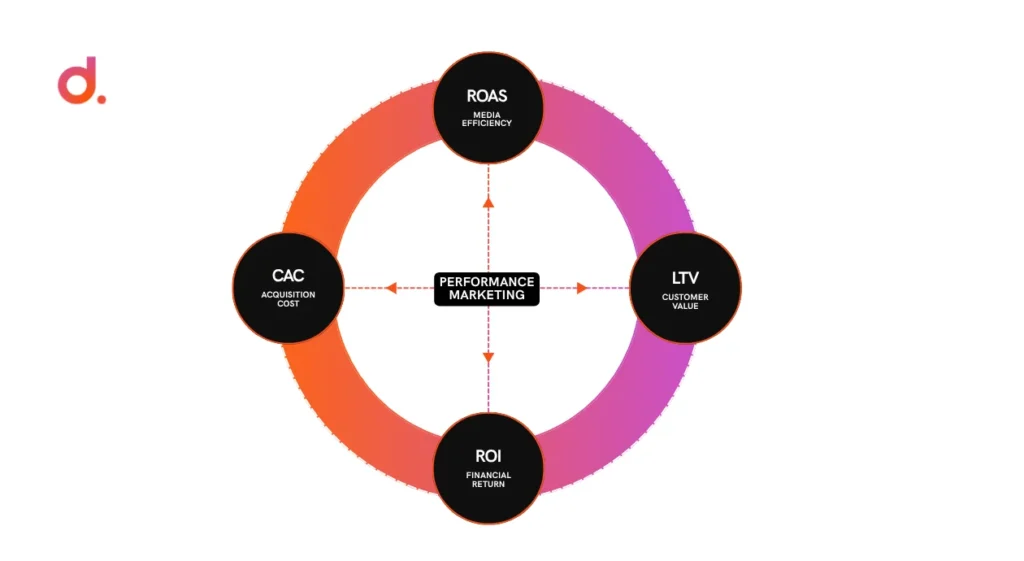
Start by separating four metrics people often mix together.
| Metric | Formula | Best use | Main warning |
| ROAS | Attributed ad revenue ÷ ad spend | Platform/media efficiency | Ignores non-media cost and attribution overlap |
| CAC | Acquisition cost ÷ new customers | Cost to acquire a customer | Definition of “acquisition cost” varies |
| LTV | Economic value of a customer over time | Long-term customer value | Easy to inflate with optimistic assumptions |
| Marketing ROI | (Return − total marketing cost) ÷ total marketing cost | Broader financial return | Attribution and margin assumptions matter |
CAC: Use the Version Finance Can Rebuild
A narrow paid CAC might be:
Ad spend ÷ new customers attributed to ads
A blended CAC can be:
Total sales + marketing acquisition cost ÷ total new customers
Both can be useful.
Just do not compare one company’s blended CAC with another company’s media-only CAC as though they are equivalent.
LTV: Stop Treating Forecasts Like Cash
Lifetime value can justify acquisition spend, but only if the assumptions are credible.
For a subscription business, LTV depends on retention, gross margin, expansion, churn, and time. For ecommerce, repeat purchase behavior varies by category and cohort.
Use observed cohort data where possible.
If a new brand has three months of history, a five-year LTV forecast is not a fact. It is a scenario.
CAC: LTV Is Useful, Not Sacred
You will see rules of thumb such as “3:1 LTV to CAC.”
Treat them as context, not policy.
A company with fast payback and strong cash flow can tolerate different economics from one with long payback and heavy working-capital needs. A high LTV: CAC ratio can also mean you are underinvesting in growth.
The ratio should inform a decision, not replace one.
A Five-Step Performance ROI Tracking Framework
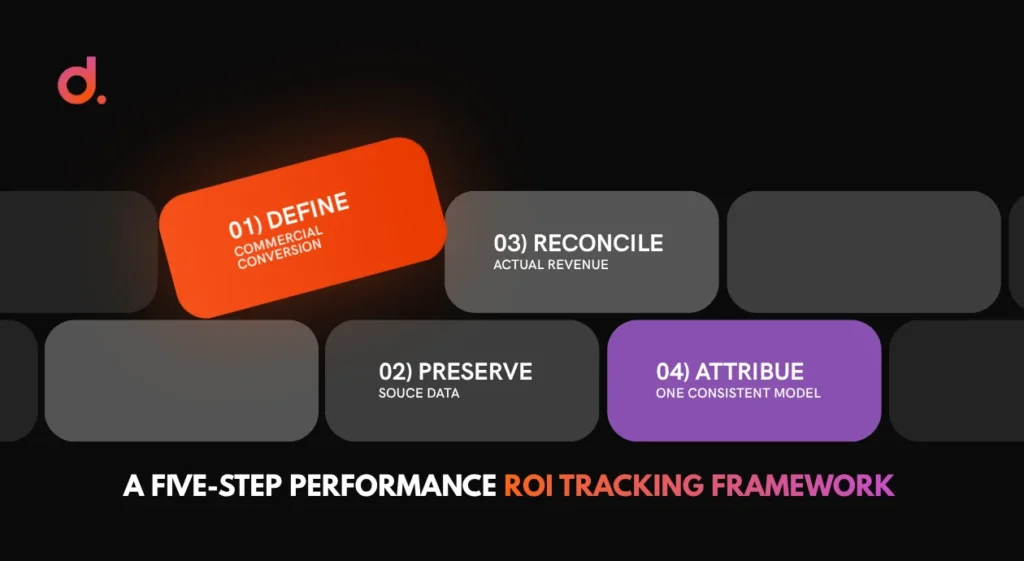
Step 1: Define the Commercial Conversion
Do not optimize “lead submitted” if only 12% of leads are qualified.
Choose the deepest reliable business outcome you can pass back:
- Qualified lead.
- Opportunity.
- Closed sale.
- Net order.
- Subscription activated.
- First payment collected.
Step 2: Preserve Source Data Through the Funnel
Keep original source, medium, campaign, landing page, and click IDs in the CRM or order system.
Do not overwrite original source when a lead comes back later through another channel. Add later-touch fields instead.
Step 3: Reconcile to Finance or the Order System
The ad platform is not the revenue ledger.
Use actual booked or collected revenue from the system that owns the transaction.
Step 4: Apply One Attribution View Consistently
GA4’s current attribution reporting can provide a shared cross-channel perspective. The model is still an estimate, but it is more useful when teams use one consistent methodology rather than presenting separate platform claims as if they are additive.
Step 5: Add Incrementality Where the Stakes Are High
If a channel receives a large budget and attribution is disputed, test it.
Use holdouts, geo experiments, audience suppression, or structured spend changes when feasible.
The question changes from “Who got credit?” to “What changed because we ran it?”
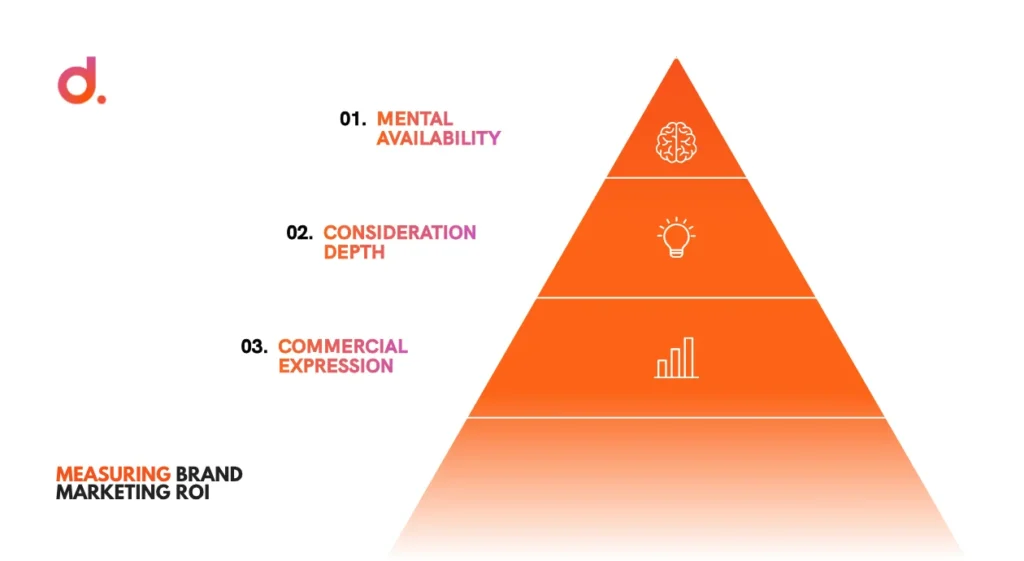
Measuring Brand Marketing ROI
Brand is where most ROI arguments go bad.
One side says brand cannot be measured.
The other side invents a precise dollar value from impressions and calls it science.
Neither is useful.
Brand effects can be measured. They are just slower, more indirect, and more distributed across the
business than a paid-search click.
A practical framework uses three layers.
| Layer | What to measure | Why it matters |
| Mental availability / consideration | Are more category buyers thinking of the brand in relevant buying situations? | Brand cannot be chosen if it is not retrieved from memory |
| Consideration depth | Do buyers understand what the brand is for and when to choose it? | Awareness without category relevance is weak |
| Commercial expression | Does stronger brand demand appear in branded search, direct demand, conversion, price resilience, or market share? | Connects brand movement to business outcomes |
Mental Availability and Category Entry Points
Ehrenberg-Bass Institute uses the idea of mental availability: the probability that a buyer notices or thinks of a brand in a buying situation. Those buying situations are often described through Category Entry Points.
For a B2B accounting platform, entry points might include:
- “We are outgrowing spreadsheets.”
- “The audit is becoming painful.”
- “We need better cash-flow visibility.”
- “The finance team needs one system.”
Brand measurement becomes more useful when research asks whether the brand is linked to those real buying situations, not only whether people recognize a logo.
The Ehrenberg-Bass How B2B Brands Grow research is a useful starting point for the mental-availability framework.
Consideration Depth
Ask buyers questions such as:
- Which brands would you consider for this need?
- Which brand comes to mind first?
- What do you associate with each brand?
- In what situation would you choose us?
- What would stop you from considering us?
Track the answers over time and by buyer category, not just among existing fans.
Commercial Expression of Brand
Brand should eventually show up somewhere in the commercial system.
Look for long-term movement in:
- Branded search volume.
- Direct and organic demand.
- Conversion rate among familiar audiences.
- Sales-cycle length.
- Close rate.
- Price sensitivity.
- Repeat purchase.
- Market share.
- Share of category buyers considering the brand.
Do not expect every brand campaign to show a clean one-to-one path from impression to order.
That is the point of brand investment: it changes how later performance channels work.
A Low-Budget Brand Measurement Setup
You do not need a global brand tracker to stop guessing.
A smaller business can start with:
- A quarterly customer/prospect survey using the same questions each time.
- Branded-search trends in Search Console and Google Trends.
- Direct and organic demand trends.
- New-versus-returning conversion rates.
- Sales-call notes on how buyers first heard about the company.
- Win/loss interviews.
- Geo or campaign tests when practical.
- The key is consistency.
- A survey that changes every quarter cannot create a trend.
The Attribution Reality Check
A marketing ROI report needs an attribution policy.
Without one, every channel can bring its own version of revenue.
If Meta says $500,000, Google says $450,000, email says $300,000, and actual revenue was $700,000, you cannot add the platform numbers.
They overlap.
Use a shared attribution view for reporting and label platform metrics as platform-attributed.
Then disclose the gaps:
- Cross-device identity limitations.
- Offline sales.
- Privacy/consent loss.
- Long buying cycles.
- Word of mouth.
- Direct traffic.
- Sales influence.
Marketing attribution is not a confession that the measurement is weak.
It is a statement of the rules used.
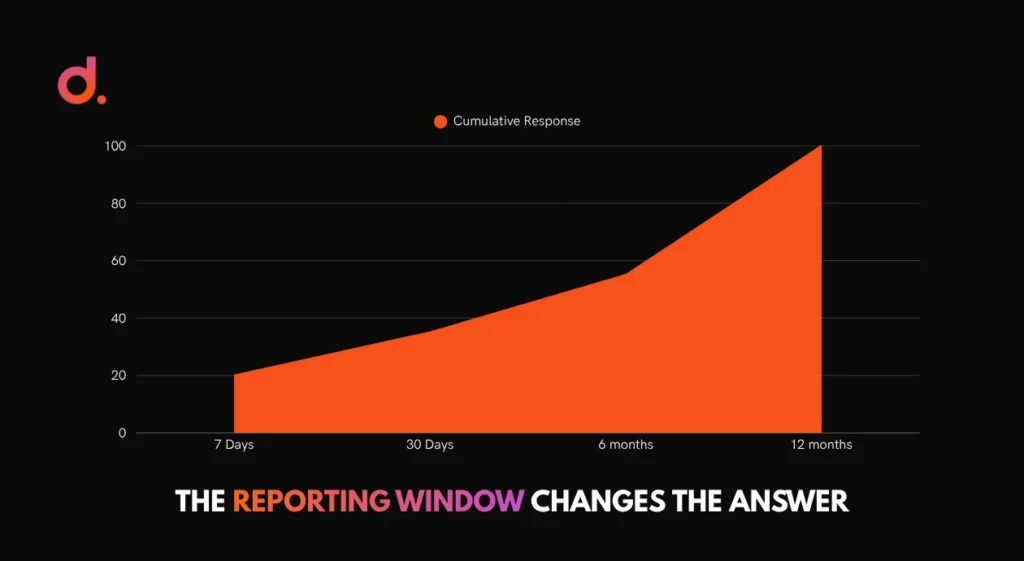
Long-Term ROI: The Reporting Window Changes the Answer
A campaign can look mediocre at 30 days and excellent at 12 months.
That is especially true for brand, content, video, category education, and channels that create future demand.
Google and WARC’s long-term measurement research argues that short-term reporting can miss a large share of sustained media returns. Their analyses are based on specific datasets and should not be treated as a universal multiplier, but the measurement lesson is sound.
Report multiple windows when the business model warrants it:
- 7 or 30 days for immediate response.
- 90 days for mid-cycle revenue.
- 6–12 months for sustained effects and repeat purchase.
Do not force every channel into the same clock.
How to Defend the Number to Anyone
A defensible marketing ROI report should survive three audiences: marketing, finance, and leadership.
Lead With Revenue, Not Activity
Do not open with:
- Impressions.
- Clicks.
- Engagement.
- Followers.
- MQL volume.
Those can explain performance later.
Open with commercial output:
- Revenue.
- Gross/contribution profit.
- New customers.
- CAC.
- Pipeline created.
- Payback.
- Retention.
Show the Trend, Not One Hero Month
One strong month can be seasonality, a promotion, inventory changes, a competitor outage, or simple noise.
Show 6–12 months where possible.
Use Financial Language
Instead of:
“TikTok engagement grew 38%.”
Try:
“TikTok prospecting increased qualified site visits, but we have not yet measured an incremental revenue lift. We are holding spend flat until the next test.”
That sounds less exciting.
It is much easier to trust.
State Uncertainty Explicitly
A useful report can say:
“GA4 data-driven attribution assigns 28% of tracked first-order revenue to paid social. Customer surveys suggest paid social has a larger discovery role. We have not run an incrementality test, so we are not treating 28% as causal contribution.”
Uncertainty is not weakness.
Hidden uncertainty is.
Attach a Budget Action
Every ROI discussion should end with a decision.
- Increase.
- Hold.
- Reduce.
- Reallocate.
- Test.
- Fix measurement before deciding.
If the report cannot change a decision, ask why the business is producing it.
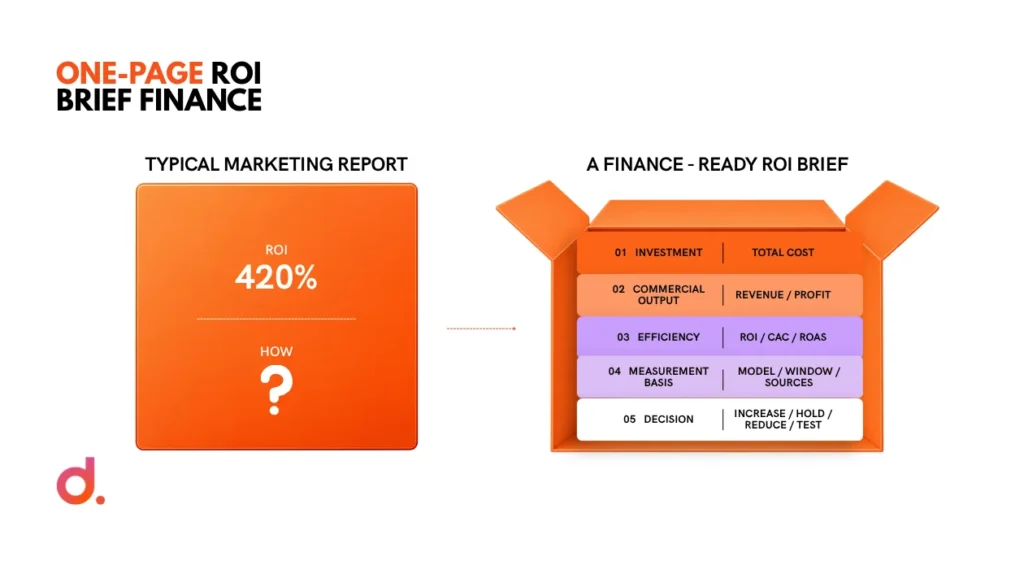
Build a One-Page ROI Brief Finance Can Rebuild
A defensible ROI presentation should be reproducible without asking marketing to explain a black box.
Keep the first page boring enough to audit.
Start with five lines:
| Line | What to show |
| 1. Investment | Full marketing cost for the period, with what is included. |
| 2. Commercial output | Booked revenue, contribution profit, new customers, or qualified pipeline, depending on the model. |
| 3. Efficiency | ROI, CAC, ROAS, payback, or another metric tied to the decision. |
| 4. Measurement basis | Attribution model, lookback window, source systems, and any holdout or incrementality method used. |
| 5. Decision | Increase, hold, reduce, reallocate, or run a specific test. |
Then put the uncertainty directly underneath it.
For example:
Paid search was associated with $420,000 in booked revenue on $90,000 of media spend during the quarter. The figure uses GA4 data-driven attribution reconciled to CRM revenue. Branded search is included, so we are not treating the full attributed amount as incremental. Recommendation: hold total spend, separate brand and non-brand reporting, and run a geo or audience holdout before approving the next budget increase.
That paragraph gives finance enough information to challenge the number intelligently. It names the money, the method, the weakness, and the next action.
A dashboard screenshot usually does not.
The same structure works for brand, but the output changes. Instead of forcing brand activity into last-click revenue, report the situation-based measures you have chosen, their trend, and the commercial signals you expect them to precede. If prompted awareness rises but category-entry-point associations stay flat, say so. If direct and branded search rise at the same time as broader mental availability, note the relationship without claiming the brand campaign caused every sale.
The strongest marketing report is not the one with the largest ROI percentage.
It is the one another department can rebuild and still reach the same conclusion.
The ROI Report Teaches the Company What to Value
This is easy to miss.
Whatever you report consistently becomes what the organization optimizes.
If the dashboard celebrates cheap leads, teams will generate cheap leads.
If it celebrates platform ROAS, teams will favor channels that receive easy attribution.
If it celebrates last-click revenue, demand creation will look inefficient.
If it celebrates booked revenue and contribution margin, teams will pay more attention to customer quality.
Measurement is not passive.
It changes behavior.
That is why the definitions need governance, not just a spreadsheet owner.
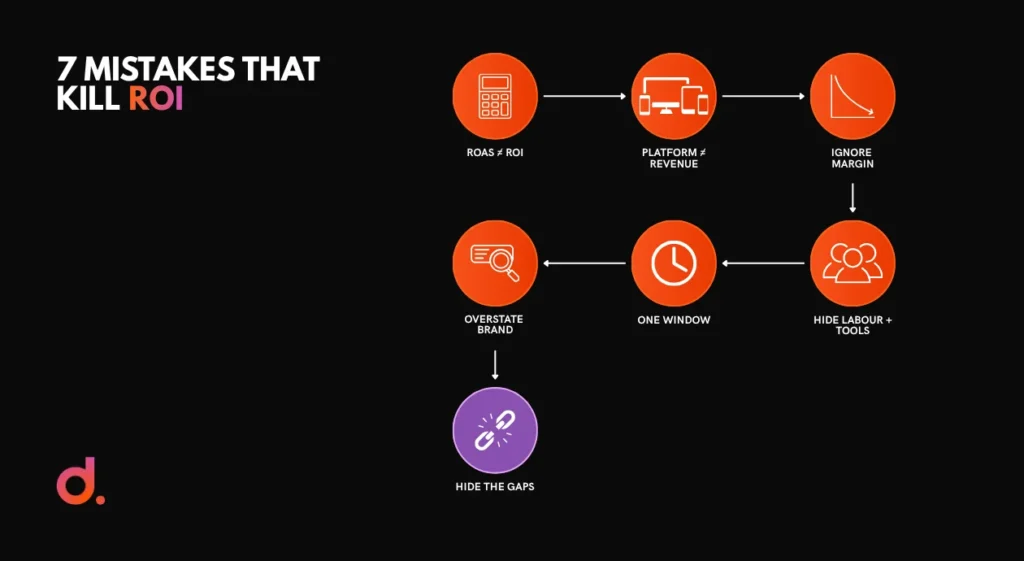
Common Mistakes That Destroy Marketing ROI Credibility
Calling ROAS ROI
ROAS is useful. It is not the same as return on the full marketing investment.
Reporting Platform Revenue as Business Revenue
Platform numbers overlap. Reconcile them to actual orders and invoices.
Ignoring Margin
Revenue can rise while profit falls.
Excluding Marketing Labor and Tools
If the work required four people and seven software subscriptions, the cost did not equal media spend.
Using One Attribution Window for Everything
A same-day purchase and a six-month B2B deal do not belong in the same reporting window.
Overstating Brand Causality
A rise in branded search after a campaign is evidence worth investigating. It is not automatic proof that every extra branded search was caused by the campaign.
Hiding Measurement Gaps
If offline revenue is missing, say it.
If the CRM changed halfway through the quarter, say it.
If a campaign has too little data, say it.
The report gets stronger when the reader knows what it cannot prove.
A Marketing ROI Scorecard You Can Actually Use
For each channel, include:
| Area | Metric |
| Spend | Media + allocated operating cost |
| Demand | Qualified traffic/leads / product interest |
| Customer quality | Qualified rate, close rate, new-customer rate |
| Revenue | Net revenue or booked revenue |
| Economics | CAC, gross/contribution profit, payback |
| Retention | Repeat rate, churn, renewal where relevant |
| Attribution | Model used + major blind spots |
| Confidence | High/medium/low based on data quality and experiment evidence |
| Action | Increase/hold/reduce/reallocate / test |
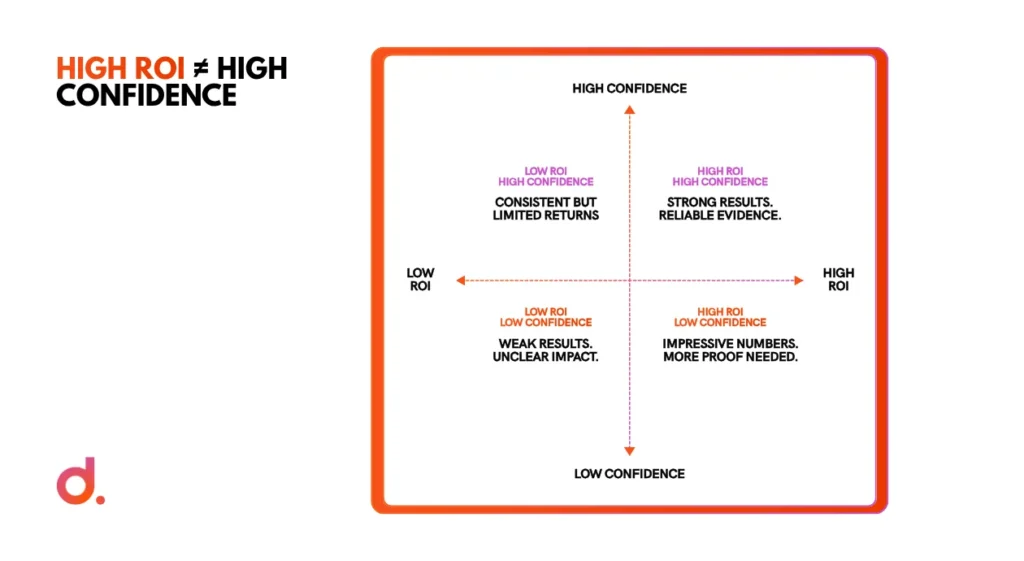
That last pair is useful.
A channel can have a high reported ROI and low confidence.
Do not treat those the same as a high-ROI channel backed by clean revenue data and an incrementality test.
Frequently Asked Questions
How do you calculate marketing ROI?
A common formula is ((marketing return − marketing cost) ÷ marketing cost) × 100. Define both sides before using it. Revenue-based ROI can overstate economics for low-margin businesses, so finance may prefer gross profit or contribution margin as the return. Include media, tools, agency, creative, and appropriate labor costs.
What is a good marketing ROI?
There is no universal good percentage. A sustainable return depends on gross margin, payback period, cash flow, retention, sales cycle, and growth goals. Compare ROI with the company’s cost structure and historical performance. A lower short-term ROI can still be rational if it creates high-value customers with strong retention and long-term contribution.
How do you measure brand marketing ROI?
Track brand consideration and mental availability, connect those changes to commercial indicators such as branded demand and conversion, and use experiments or market-level analysis where possible. Measure over a longer window than direct-response media. Avoid converting awareness metrics directly into dollars unless the methodology can be defended.
What is the difference between ROAS and marketing ROI?
ROAS compares attributed ad revenue with media spend. Marketing ROI compares a defined financial return with the broader cost of marketing. ROAS is helpful for media optimization. ROI is more useful for financial evaluation because it can include agency, creative, software, labor, margin, and other costs required to generate the return.
How do I prove marketing ROI to finance?
Start with real revenue or profit, document the attribution rule, include the full cost, show trends over time, state known gaps, and connect the result to a budget action. Finance does not need marketing to pretend uncertainty is zero. It needs a number it can trace back to transactions and assumptions.
A Defensible Number Beats a Bigger Number
Marketing teams often think the goal of ROI reporting is to prove marketing deserves more budget.
That creates the wrong incentive.
The goal is to help the business allocate money well.
Sometimes the report should support more spend. Sometimes it should show that a channel is over-credited. Sometimes it should reveal that the tracking is too weak to make the decision yet.
That is still a useful outcome.
Start with actual revenue. Count the real cost. Choose an attribution rule and state it. Separate performance from brand effects. Use longer windows where the buying cycle requires them. Test incrementality when the decision is expensive.
Then show the assumptions beside the number.
Digital Shaping’s performance and growth services are built around the same standard: revenue first, diagnosis before delivery, and reporting that can change a business decision instead of decorating a dashboard.
If the ROI number cannot survive a simple question from finance, it is not ready for the slide.